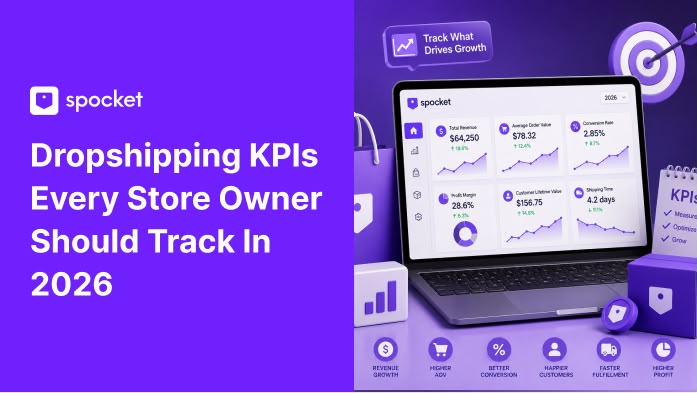
Key Dropshipping KPIs Every Store Owner Should Track in 2026
Vanity metrics won't pay the bills. Track these dropshipping KPIs to cut wasteful ad spend, boost repeat sales, and finally know what's working.

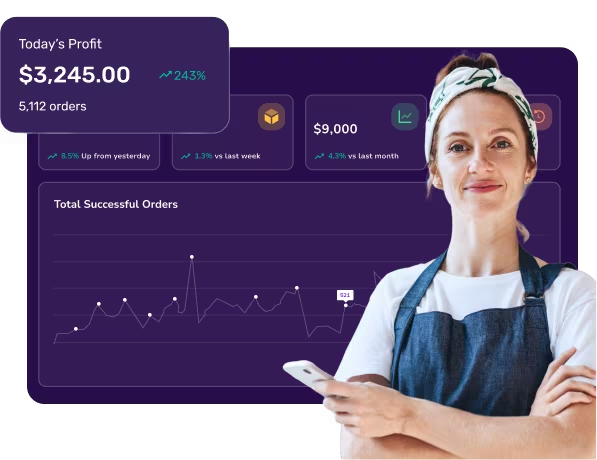
Most dropshippers treat their store like a black box. Money goes in, some comes out, and they hope the difference is profit. That's not a business. That's gambling with extra steps. The ones who actually last, the ones who scale to six figures and beyond, they know their numbers are cold. Not just revenue. The ugly ones too. Cost per acquisition, margin per order, repeat purchase rate, return rate. They track them weekly. They make decisions based on them, not hunches.
This blog is your starter kit for the dropshipping metrics that matter. I'll break them down by category so you know what to look at, why it matters, and what to do when the numbers look off. No fluff. Just the KPIs that move the needle.
Why Tracking KPIs Is Non-Negotiable for Dropshipping Stores?
Dropshipping looks simple from the outside. List products, run ads, fulfill orders. But the margins are tight and the variables are endless. Your supplier changes the price. Your ad creative fatigues. A competitor undercuts you. If you're not watching the right numbers, you won't notice the leak until the whole bucket is empty.
KPIs are your dashboard. They tell you which products are actually profitable after shipping and fees. They show you which ad sets are burning cash. They warn you when a supplier's quality is slipping before the one-star reviews pile up. Without them, you're driving blind. With them, you can spot problems early and double down on what's already working.
Before diving into the specific metrics, it helps to have your product sourcing dialed in. If you're still hunting for reliable items, trending dropshipping products on Spocket are updated based on actual demand. Good products make good KPIs easier to hit.
Top Dropshipping KPIs That Actually Matter
Not every metric deserves your attention. Vanity metrics like total page views or social media followers feel good but don't pay the bills. These are the ones that directly connect to profit.
1. Customer Acquisition KPIs
These numbers tell you how much it costs to get someone to your store and whether those people are the right audience.
Cost Per Acquisition (CPA). This is the big one. How much you spend on ads to get one paying customer. If your CPA is $18 and your profit per order is $12, you're losing $6 on every sale. That math doesn't fix itself. Track CPA by channel, by campaign, by product. Know it cold. A good CPA target depends on your average order value and margin, but if CPA exceeds 30% of your AOV, you need to optimize or raise prices.
Return on Ad Spend (ROAS). ROAS is revenue from ads divided by ad spend. A ROAS of 3 means you spent $1 and made $3 back. But ROAS doesn't account for product cost, shipping, or fees. So a ROAS of 2 might still be unprofitable. Use it as a quick health check, but always calculate net profit per order alongside it.
Click-Through Rate (CTR). Low CTR means your ad creative isn't resonating or you're targeting the wrong audience. High CTR but low conversion means your landing page or product page needs work. CTR is an early signal that something is off before you waste hundreds on clicks that never convert.
Cost Per Click (CPC). CPC varies wildly by niche and platform. What matters is the trend. If CPC is climbing while conversion rate stays flat, your efficiency is dropping. Either improve your ads, test new audiences, or shift budget to channels where CPC is lower.
For sourcing products with margins that can support healthy acquisition costs, dropshipping suppliers on Spocket provide transparent pricing so you can calculate your numbers before you spend a dime on ads.
2. Conversion KPIs
Acquisition gets them in the door. Conversion gets them to pull out a credit card.
Overall Store Conversion Rate. The percentage of visitors who make a purchase. A 1-2% conversion rate is typical for dropshipping stores. Below 1% means something is broken. Your product pages, your pricing, your trust signals, or your traffic quality. Fix the biggest bottleneck first. Often it's the product page or the checkout flow.
Add to Cart Rate. How many visitors add at least one item to their cart. If this is low, your product page isn't convincing. If it's high but purchase conversion is low, your cart or checkout is the problem. This split helps you diagnose where the friction lives.
Cart Abandonment Rate. The percentage of people who add to cart but never complete the purchase. The average hovers around 70%. If yours is above 75%, focus on cart recovery emails, shipping transparency, and trust badges. If it's below 60%, you're doing well. Every percentage point you recover is free revenue.
Checkout Abandonment Rate. This is the sub-set who actually start the checkout process but bail. Common culprits: forced account creation, unexpected shipping costs, too many form fields, no guest checkout option. Fix these and you'll see an immediate lift.
Landing Page Conversion Rate. If you run ads to dedicated landing pages, track how many visitors convert on that specific page. This isolates your ad creative and offer strength from the rest of your store experience. A low landing page conversion rate means the offer or the page design needs testing.
3. Revenue and Profit KPIs
Revenue is vanity. Profit is sanity. These KPIs make sure you're actually making money.
Average Order Value (AOV). Total revenue divided by number of orders. Raising AOV is one of the fastest ways to increase profit because your acquisition cost stays the same but you earn more per customer. Upsells, cross-sells, bundles, and free shipping thresholds all push AOV up.
Gross Profit Margin. Revenue minus product cost and shipping, divided by revenue. This is the margin before ad spend and other expenses. If your gross margin is below 40%, you have very little room for error after you factor in ads and fees. Use the profit margin calculator to run scenarios before listing any product.
Net Profit Margin. What's actually left after all costs: product, shipping, transaction fees, ad spend, platform fees, apps, everything. If this number is negative, you're paying to run your business. Track it monthly and per product. A product with high gross margin but terrible net margin after ad spend needs to be cut or re-priced.
Customer Lifetime Value (LTV or CLV). How much revenue the average customer generates over their entire relationship with your store. If your average customer buys once for $45 and never returns, your business relies entirely on new customer acquisition. If they buy three times over six months for a total of $120, you can afford to spend more to acquire them initially. LTV is what turns a break-even first purchase into a profitable customer relationship.
Revenue by Product and Category. Not all products pull their weight. Track which SKUs and categories generate the most profit, not just the most revenue. A $50 item with $5 profit might look great on the revenue chart but terrible on the profit chart. Kill the losers, scale the winners.
Start your dropshipping business today
Join Spocket for FREE!
4. Customer Retention KPIs
Getting a new customer costs way more than keeping an existing one. These KPIs show whether you're building a brand or just churning through one-time buyers.
Repeat Purchase Rate. The percentage of customers who buy more than once. For dropshipping, anything above 20% is strong. Below 10% means your customers don't trust you enough to come back or your products aren't re-purchaseable. Email marketing, loyalty programs, and post-purchase follow-ups all improve this number. For help building the email side, our resource on email marketing covers the setup from scratch.
Customer Churn Rate. The percentage of customers who stop buying over a given period. High churn means your product quality, shipping speed, or customer service is driving people away. Dig into the data. Are customers leaving after one bad experience? Are specific products generating more refunds? Fix the root cause.
Email Engagement Metrics. Open rates, click rates, and unsubscribe rates tell you if your email marketing is working or annoying people. Low open rates usually mean your subject lines are weak or your list is stale. Low click rates mean your content or offers aren't compelling. Track these monthly and A/B test subject lines and send times.
5. Operational KPIs
These numbers reflect the back-end of your business. They don't show up on a profit and loss statement directly but they drive customer satisfaction and long-term reputation.
Order Defect Rate. The percentage of orders that result in a refund, chargeback, or formal complaint. Anything above 2-3% and your payment processor may flag your account. More importantly, high defect rates signal supplier problems or product quality issues that will destroy your brand. Investigate every defect.
Average Shipping Time. How long from order to delivery. If you're using US-based suppliers through Spocket, this should be 2-5 business days. If it's creeping higher, your supplier may be experiencing delays. Long shipping times are the number one reason dropshippers get bad reviews. Track this by supplier and by product. Drop suppliers who can't meet your delivery promises.
Supplier Fill Rate. The percentage of orders your supplier fulfills on time without issues. If a supplier cancels 5% of your orders because they're out of stock, that's 5% of your revenue gone plus angry customers. Track fill rate per supplier and have backups ready for your best-selling products.
Return Rate. What percentage of orders get returned. High return rates mean your product photos or descriptions are misleading, or the product quality is poor. By the time the return happens, the damage is done. But tracking the rate helps you spot which products need better descriptions, more accurate sizing charts, or higher-quality photos.
How to Actually Track These KPIs?
You don't need a fancy setup to start. Most of these numbers live in tools you already have.
Shopify Analytics gives you conversion rate, AOV, return rate, and basic customer reports. It's the starting point for most dropshippers. Google Analytics adds deeper traffic insights, landing page performance, and multi-channel attribution. Pair them together and you have a solid baseline.
For ad-specific KPIs, each platform has its own dashboard. Facebook Ads Manager, TikTok Ads Manager, Google Ads. They'll give you CPA, ROAS, CTR, and CPC at the campaign and ad set level.
When you outgrow the free tools, paid options like Triple Whale and Northbeam unify data from Shopify, ad platforms, and email tools into a single dashboard. They give you a clearer picture of customer lifetime value, attribution, and profitability per product. Worth the investment once you're spending over $5,000 a month on ads.
For operational KPIs like shipping time and supplier fill rate, you'll track those manually or through your order management platform. Spocket's dashboard shows supplier performance and shipping estimates, which helps you flag issues before they become customer complaints.
The key is consistency. Pick a day each week to review your top 5 KPIs. Write them down. Watch the trends. If CPA is climbing three weeks in a row, investigate. If AOV drops, check your product mix. Don't wait until the end of the month to discover you lost money.
Common KPI Mistakes That Lead to Bad Decisions
Even with the right metrics, it's easy to misread the data. These are the traps to avoid.
- Chasing ROAS without watching profit. A ROAS of 5 looks amazing until you subtract product cost, shipping, and fees and realize you're netting $2 per order. Always calculate net profit per order. ROAS is a starting point, not the finish line.
- Ignoring customer acquisition cost trends. If CPA was $12 last month and $19 this month, something changed. Maybe your audience is fatigued, maybe a competitor entered, maybe your ad creative got stale. Track CPA weekly. When it rises, dig in immediately.
- Not segmenting new vs. returning customers. Your overall conversion rate might be 2%, but if new visitors convert at 0.5% and returning visitors convert at 5%, you have two very different problems. Segment your analytics so you know where to focus.
- Relying on platform attribution alone. Facebook and TikTok will happily take credit for sales that would have happened anyway. Use a tool like Triple Whale or Northbeam to get a more honest view of attribution, especially if you're running multiple channels.
- Ignoring post-purchase experience. Your repeat purchase rate, return rate, and review scores tell you whether your product and fulfillment are delivering on your marketing promises. If those numbers are bad, no amount of ad optimization will save you. Fix the product and the fulfillment first.
Conclusion
You don't need to track 30 KPIs from day one. Start with five: CPA, conversion rate, AOV, net profit margin, and return rate. Get those dialed in. Review them weekly. Let the trends guide your decisions. As you grow, layer in LTV, repeat purchase rate, and operational metrics like shipping time and supplier fill rate. The dropshippers who win aren't the ones with the biggest ad budgets. They're the ones who know exactly where every dollar is going and whether it's coming back.
Ready to source products that make your KPIs look good? Start your free trial with Spocket and browse US and EU suppliers with fast shipping and transparent pricing.
Key Dropshipping KPIs Every Store Owner Should Track 2026 FAQs
What's the most important KPI for a new dropshipping store?
Cost per acquisition (CPA) combined with net profit per order. If you don't know how much it costs to acquire a customer and whether that customer is profitable, you're flying blind. Track these from day one before you scale any ad spend.
How often should I review my dropshipping KPIs?
Review your top 5 KPIs weekly. Monthly reviews are for deeper analysis like customer lifetime value trends, channel performance comparisons, and supplier evaluations. Weekly checks catch problems before they compound.
What's a good conversion rate for a dropshipping store?
1% to 2% is typical. If you're below 1%, audit your product pages, pricing, trust signals, and traffic quality. If you're above 3%, you're doing well. Keep testing to maintain and improve.
Should I track KPIs differently for different products?
Yes. A $15 impulse product will have different CPA, AOV, and margin profiles than a $75 premium item. Segment your KPIs by product and by category so you're not averaging out important differences.
What tools do I need to track dropshipping KPIs?
Start with Shopify Analytics and Google Analytics. Add your ad platform dashboards. When you're spending over $5,000 a month on ads, consider Triple Whale or Northbeam for unified attribution and profit tracking.
How do I know if my supplier is hurting my KPIs?
Track shipping time, return rate, and supplier fill rate per supplier. If one supplier consistently delivers late, cancels orders, or generates more returns, their products are damaging your store's reputation and your metrics. Switch suppliers before it gets worse.


Launch your dropshipping business now!
Start free trial.avif)


Related blogs
.avif)
How to Set Global Pricing Rules on Spocket to Protect Your Margins
Learn how to configure Spocket pricing rules to protect your profit margins. Set global pricing rules, automate markups, and maximize dropshipping profits.

How to Increase Average Order Value in Your Dropshipping Store with Spocket?
Learn how to increase AOV dropshipping Spocket way. We share practical product positioning strategies, pricing, fulfillment tips.


Spocket Supplier Vetting Process: How Are Suppliers Approved?
Learn how Spocket vets its suppliers. Find out how suppliers are approved and what is the Spocket supplier vetting process. Full details inside.